[Guest Post] Embracing the Journey: Reflecting on My Open Data Research
— by Andrew Cheung
Note: HKU Libraries is committed to fostering the next generation of researchers and advancing open science. In our recent collaboration with the Bachelor of Arts and Sciences in Social Data Science (BASc(SDS)) programme, where students tackle real-world challenges in their Final Year Projects, two groups of students explored automatic detection of Data Availability Statements (DAS). This is the second post in the two-part series where the students share their exploration and findings. Today’s post is by Andrew Cheung. Andrew was a student in the Bachelor of Arts and Sciences in Social Data Science programme at the University of Hong Kong in 2024-2025.
In today’s fiercely competitive world, many people become so fixated on their ultimate goals that they overlook the importance of the journey to get there. While achieving desired outcomes is important, we must remember not to lose sight of the process and the valuable lessons learned along the way.
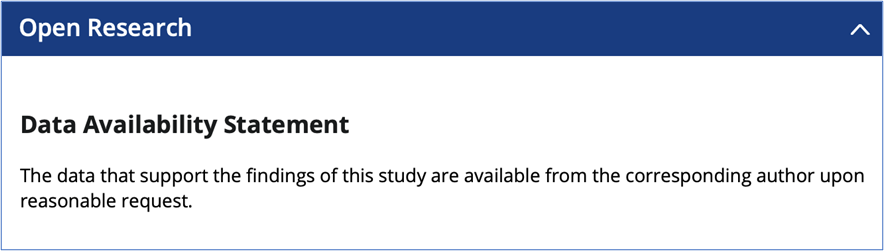
In this blog, I want to share how I approached my research project on Open Data. My goal was to collect Data Availability Statements (DAS) – which specify where readers can access the research data referenced in an article – from various journals to examine how HKU researchers have been sharing their data with the public over the last decade, from 2014 to 2024. These statements are typically found at the bottom of the article’s webpage.
I will not be diving into the findings of the project here. Instead, I want to highlight the tools and methods I used throughout my journey, hoping to remind everyone to reflect on their progress, not just to celebrate successes or feel disappointed when things do not go as planned. Ideally, this blog will also provide insights into how you might approach your own research project.
My project was structured into six main sections: domain knowledge acquisition, sampling, web scraping, content extraction, content classification, and finally, data analysis.
Domain Knowledge Acquisition and Sampling
Often, we start research projects without enough domain knowledge. That was certainly the case for me during my project. Open Science and its branch, Open Data, promoted by the HKU Libraries, were fairly new to me. So, I started by doing a literature review to get a grasp of what it is all about, where the gaps are, and why it matters.
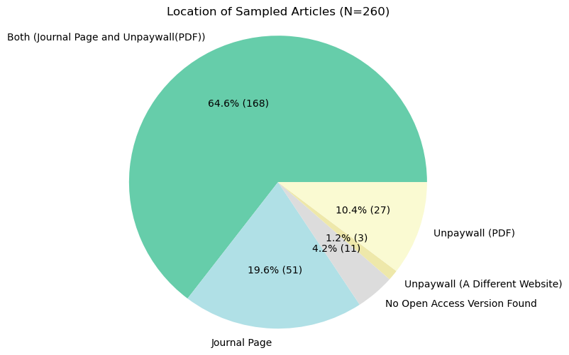
In addition to the literature, I also reviewed various journal pages to see what kind of data I would be collecting. I manually gathered samples – 260 statements in total – and took notes on my observations from the webpages. This process really helped me understand what I need to consider when creating computer programs to automate collection and extraction tasks.
Web Scraping
The first program I developed was a web scraping tool (for those unfamiliar, web scraping is the process of automatically extracting data from websites). Initially, I was not familiar with web scraping and did not know which tools to use or how to apply them. However, I did not let that discourage me. Learning new techniques on the fly is a common part of research, and it is important to keep an open mind and embrace the opportunities that come our way.
Trying something new could feel uncomfortable, but we should not be afraid as long as we approach it wisely and manage the risk. By ‘risk’, I mean time, as we certainly do not want to invest too much effort into something that might not work out. So, before diving into large-scale scraping, I conducted technical spikes to test various packages and frameworks. Ultimately, I found that Scrapy was the most effective and efficient option in my case.
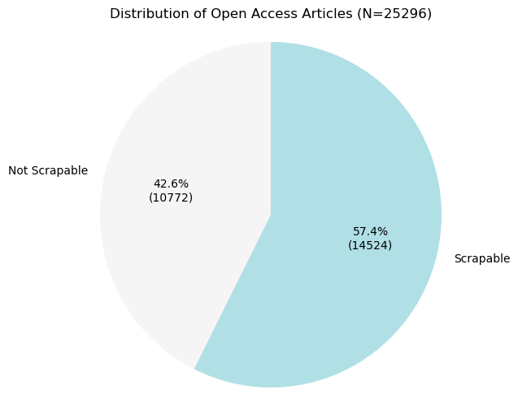
From all the Open Access articles affiliated with HKU from 2014 to 2024 (a total of 25,296 articles), I successfully scraped 14,524 article webpages.
Content Extraction
With the web pages scraped, the next step was to extract the specific section needed. This was not easy; it took quite a bit of testing, tweaking, and redesigning to create an effective pipeline.
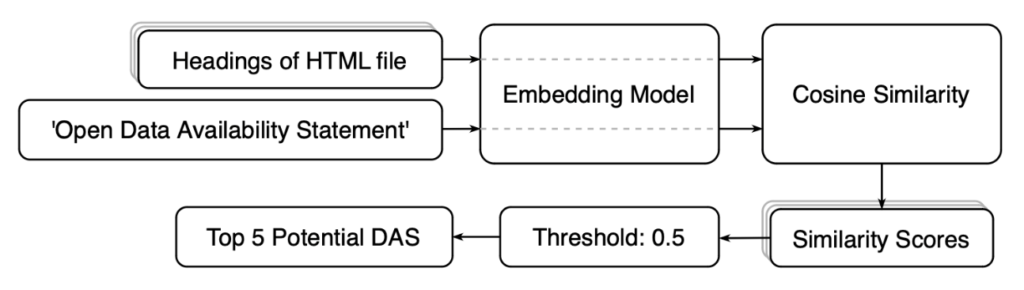
First, I extracted all the headers from the pages (by headers, I mean the titles of each section). Each header, along with the pre-defined statement ‘Open Data Availability Statement’, was then processed through an embedding model for vectorization and similarity calculation. Only the top five headers that met a similarity threshold of 0.5 were considered potential DAS.
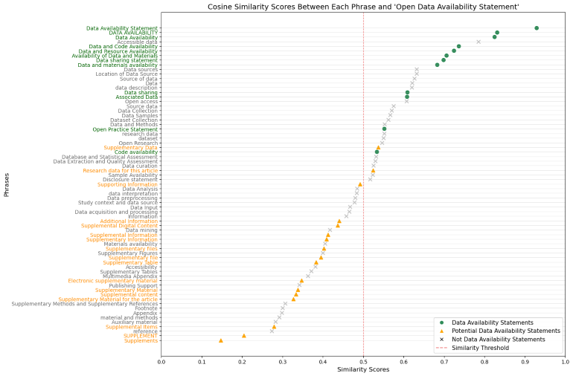
This 0.5 threshold was set based on a collection of DAS, potential DAS, and phrases identified as not DAS. To collect these phrases, I searched for keywords like ‘data’, ‘supplementary’, ‘material’, ‘available’, and ‘support’ in the 260 samples. Since all DAS could be captured by a similarity score of 0.5 or above, as shown in Figure 5, it became the benchmark.
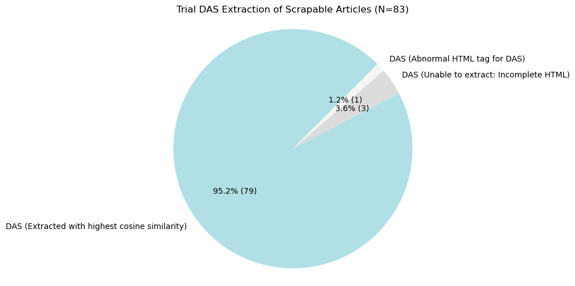
After developing a method to extract DAS, I conducted a trial extraction to test the effectiveness of the pipeline, and it turned out that 95% of the DAS, along with their content, were successfully extracted with the highest similarity score. With its solid performance, this pipeline was then used to extract DAS content from the scraped articles.
Content Classification
| In Paper or SI | Repository | Access Restricted | Upon Request | |
| True Type (Total) | 4355 | 9027 | 3706 | 1040 |
| In Paper or SI | 2411 | |||
| Repository | 7326 | |||
| Access Restricted | 3437 | |||
| Upon Request | 683 | |||
| Not Applicable | ||||
| Combination | 1944 | 1701 | 269 | 357 |
| False Type (Total) | 4417 | 6961 | 3889 | 1190 |
| In Paper or SI | 2411 | 1199 | 314 | |
| Repository | 1836 | 1050 | 262 | |
| Access Restricted | 1711 | 3437 | 294 | |
| Upon Request | 683 | 683 | 683 | |
| Not Applicable | 7 | 7 | 7 | 7 |
| Combination | 180 | 423 | 950 | 313 |
| Total Data Entries | 8772 | 15988 | 7595 | 2230 |
| Depth | Criterion | Estimators | Learning Rate | |
| Random Forest – Repository | None | Entropy | 640 | N/A |
| Random Forest – In Paper or SI | None | Entropy | 320 | N/A |
| CatBoost – Upon Request | 16 | N/A | 640 | 0.02 |
| XGBoost – Access Restricted | 8 | N/A | 640 | 0.08 |
| True/1 (Classified as the Type) | False/0 (Not Classified as the Type) | |||||||
| Precision | Recall | F1 | Support | Precision | Recall | F1 | Support | |
| Random Forest – Repository | 0.96 | 0.96 | 0.96 | 1371 | 0.95 | 0.94 | 0.94 | 1028 |
| Random Forest – In Paper or SI | 0.96 | 0.93 | 0.94 | 662 | 0.93 | 0.96 | 0.94 | 654 |
| CatBoost – Upon Request | 0.85 | 0.93 | 0.89 | 161 | 0.93 | 0.84 | 0.89 | 174 |
| XGBoost – Access Restricted | 0.91 | 0.96 | 0.93 | 548 | 0.96 | 0.91 | 0.93 | 592 |
Up to this point, I had finished collecting the data. To analyze it effectively, I needed to classify the content into different categories. Initially, I thought I could use a similar method to the content extraction I had developed earlier, by embedding the content and performing similarity calculations with defined categories. However, after testing it on the collected samples, I found that its accuracy was similar to random guessing. This was primarily because a single piece of content could potentially belong to multiple categories.
Realizing this, I shifted my approach and began searching online for potential datasets to train my own classification models. Fortunately, I discovered a dataset from an article analyzing DAS. However, I encountered the same complexity with a category called ‘combination’ in the dataset. This category posed a challenge for model training, as I needed to figure out how to handle it appropriately.
While it was possible to train a model to classify content into the ‘combination’ category, this would not be very meaningful, since we would not be able to identify the specific categories within each combination. Additionally, it could lead to underestimating other categories by categorizing some of their DAS content simply as ‘combination’.
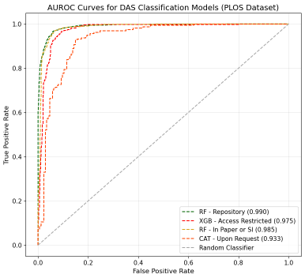
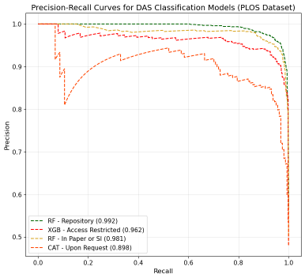
In the end, I came up with the idea to train classification models individually for each category. This way, the ‘combination’ data could be classified as either true or false for training. I ended up training four classification models, and their performance was satisfactory, with metrics around 90%.
Data Analysis
At this stage, all the data was ready for analysis and generating findings. This part was fairly straightforward; I answered the initial research questions one by one from different perspectives by creating various charts. I will not go into the actual findings here, but if you are interested in what I discovered, feel free to check out my poster for more details: https://doi.org/10.25442/hku.29324960. The charts may appear small when they first load, so do not forget to zoom in for a closer look!
Last but not least, I encourage everyone to take a step back from being overly result-oriented every now and then. Slow down, reflect on your journey, and appreciate the effort you have invested. It is in those moments of reflection that we truly understand our growth and the significance of our work, regardless of the outcomes. Embrace the journey, and let it enrich your path forward.