What the Data Means: Documenting Research (Meta)data
— by Chloe Ng
For research data to be discovered and reused, it needs to be easy to understand. Even before a dataset is finalised, researchers returning to their own data later, or collaborators working with it, need clear explanations and context to know what the data mean. Data documentation provides this information, helping others understand the data and use it correctly.
Researchers can document their data files at two levels: study level and data level.
Study-level documentation
Study-level documentation provides information applicable to all data files in the research project, answering the following questions (CESSDA Training Team, 2017–2022):
- For what purpose was the data created?
- What does the dataset contain?
- How was the data collected?
- Who collected the data, where, and when?
- How was the data processed?
- What possible manipulations or modifications were done to the data?
- What were the quality assurance procedures?
- How can the data be accessed and used?
One common way to present study‑level documentation is through a README file. A README is like a welcome guide to the dataset, introducing what the folder contains, how the files are named, who to contact for questions, and what software or system requirements are needed to open the files. Researchers may refer to this README template, covering both study‑level and data‑level documentation.
Data-level documentation
Data‑level documentation helps users understand the contents of individual data files and how the data should be interpreted. It allows users to know what data is available at a glance. Unlike study‑level documentation, which often follows a similar structure across projects, data‑level documentation varies depending on the type of data being shared (UK Data Service, n.d.).
Documentation of quantitative data
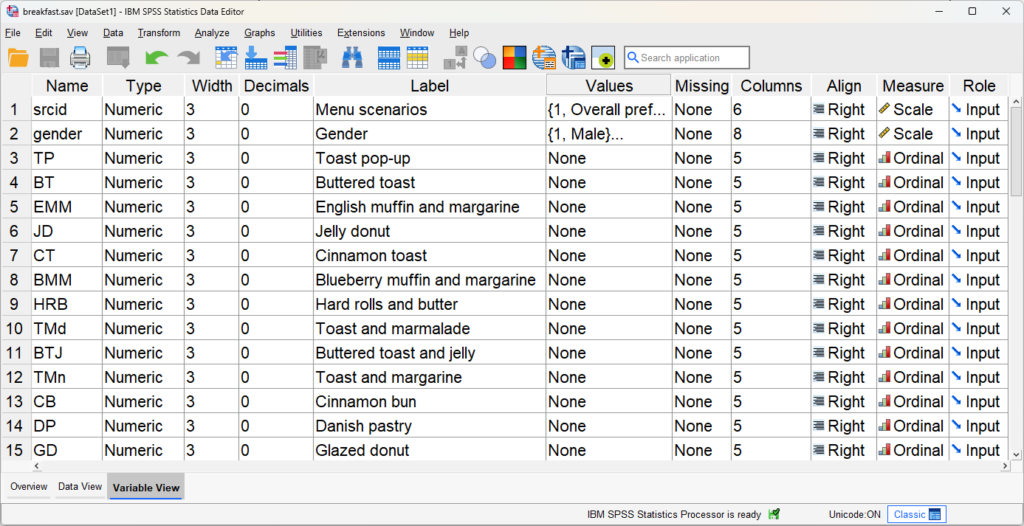
For quantitative data, data users need to understand what the numbers represent. Many data analysis software packages already include built‑in features to support data documentation (UK Data Service, 2026b). For example, in SPSS, the Variable View allows researchers to record variable labels, value descriptions, and other explanatory details directly within the data file.
Alternatively, researchers may create structured codebooks or data dictionaries that list variable names, labels, definition of parameters, units of measurement, codes for missing values, etc.
Documentation of qualitative data
For qualitative data, the background, contextual information, and participant details can be recorded at the beginning of each data file, either as a header or a brief summary section (UK Data Service, 2026a).
A data list, like a table of contents, helps users to quickly locate relevant materials within a larger collection. For example, when working with interviews, the data list describes who the participants are, when and where the data were collected, and what each file contains.
Qualitative management software like NVivo can be helpful in documenting and annotating text-based and multimedia data.
Metadata
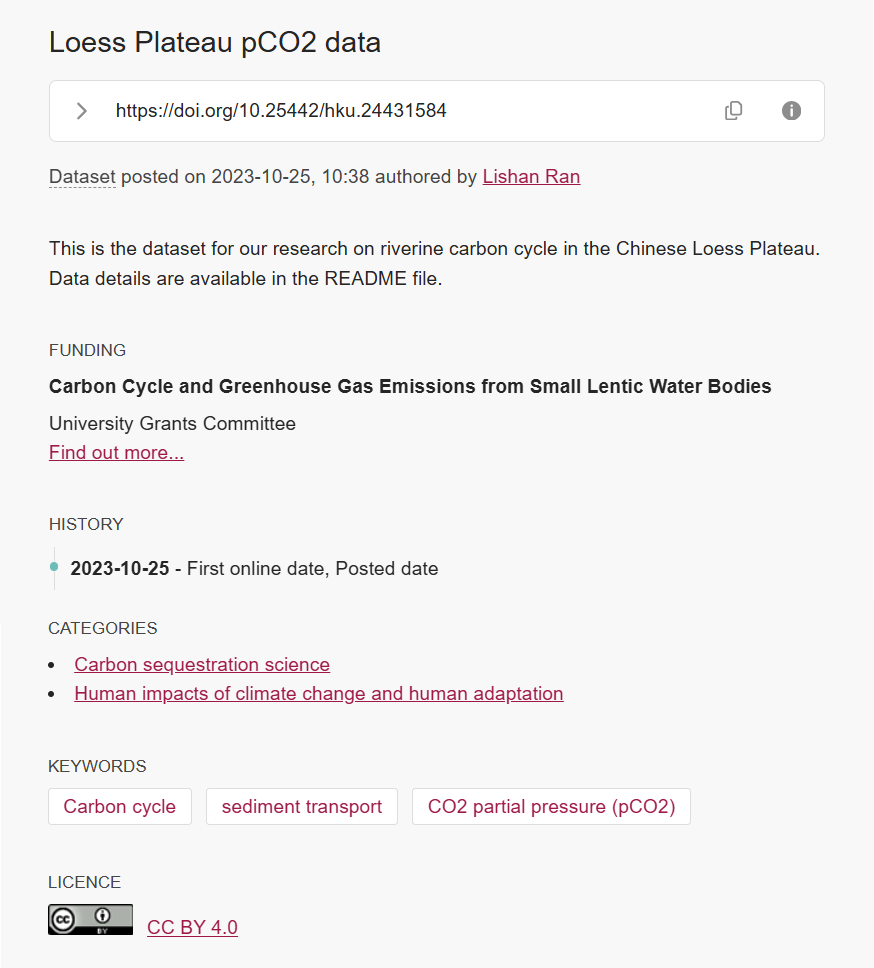
Data documentation focuses on explaining data for human readers. In contrast, metadata provides structured, machine-readable information that enables discovery and interoperability across computer systems, while also supporting human use (UK Data Service, n.d.). It may include the creator information, time references, geographic location, access conditions and terms of use of a data collection. With metadata, datasets can be indexed and searched by repositories, search engines, and other software tools.
Metadata should follow metadata standards, such as Dublin Core. Researchers can also look for metadata standards used in their specific discipline from the Disciplinary Metadata list prepared by Digital Curation Centre. For research data deposited in HKU DataHub, the institutional data repository of the University of Hong Kong, the metadata is based on the DataCite metadata schema.
Clear data documentation and well‑structured metadata together make research data understandable, discoverable, and reusable over time. These practices not only benefit others who may reuse the data in the future, but also help researchers themselves revisit their own work with reference more easily.
Extended readings:
References
CESSDA Training Team. (2017–2022). CESSDA Data Management Expert Guide. Bergen, Norway: CESSDA ERIC. Retrieved from https://dmeg.cessda.eu/
UK Data Service. (2026a). Data documentation: qualitative data. Retrieved 19 March 2026 from https://ukdataservice.ac.uk/learning-hub/research-data-management/document-your-data/data-level/data-documentation-qualitative-data/
UK Data Service. (2026b). Data documentation: quantitative data. Retrieved 19 March 2026 from https://ukdataservice.ac.uk/learning-hub/research-data-management/document-your-data/data-level/data-documentation-quantitative-data/
UK Data Service. (n.d.). Best practices for documenting data collections. Retrieved 19 March 2026 from https://trainingmodules.ukdataservice.ac.uk/documenting_collections/
Declaration of Generative AI use
I acknowledge the use of Generative AI tools in writing this post. I used:
- Microsoft Copilot to paraphrase text, draft the concluding paragraph and refine the language.
I declare that I reviewed and edited the contents as needed, and take full responsibility for the content of the post; And the information provided is complete and accurate.